
Covid-19 Statistics Daily Update
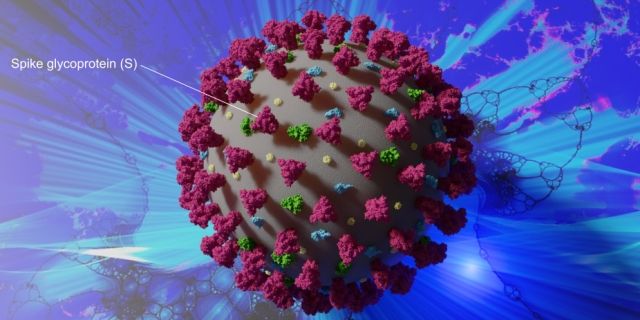
Figure 1. severe acute respiratory syndrome coronavirus 2 (SARS-CoV-2) virus that causes COVID-19 disease. Spike glycoproteins (S) on the surface interact with ACE2 proteins present on surfaces of human cells. The interaction allows the virus to enter inside a human cell and take over its replication machinery to produce copies of the virus. The virus copies can, in turn, infect more cells.
| Resource | Country | Remarks |
|---|---|---|
| COVID-19 Dashboard | Worldwide | By the Center for Systems Science and Engineering (CSSE) at Johns Hopkins University (JHU). JHU continually updates the dashboard. It is comprehensive and detailed to the state, county, and city levels. It includes a clickable map. |
| COVID19info.live | Worldwide | COVID19info.live provides the latest information on the COVID-19. The site has many interesting charts and also provides comparisons of COVID-19 with SARS and H1N1 (Swine Flu). The site is designed, developed and funded by Shortbread |
| WHO Coronavirus Disease (COVID-19) Dashboard | Worldwide | WHO provides interactive charts and maps on territory and country level. |
| CDC COVID Data Tracker | USA | The Centers for Disease Control and Prevention (CDC) provides numerical statistics on confirmed cases and deaths by state. CDC also provides statistics on COVID-19 Laboratory Tests Performed by State/Territory. |
| Coronavirus (COVID-19) cases in the UK | UK | Produced and maintained by the government of the UK. The site contains the UK specific statistics on COVID-19. On Tuesday 4 August 2020, this site will be retired and replaced by another site, which currently available as BETA (staging) service. |
Other resources
COVID-19 SARS-CoV-2 preprints from medRxiv and bioRxiv
Virus Outbreak Simulator for the US
Virus Outbreak Simulator for the UK