
Best bioinformatics tools for beginners
Learning objectives: Get an overall understanding of bioinformatics resources.
Introduction

Hello, and welcome to the realm of bioinformatics! Are you curious how scientists make sense of the massive volumes of biological data created daily? Bioinformatics is the solution! Bioinformatics has transformed how we comprehend life sciences with high-throughput sequencing methods and strong computational tools.
Bioinformatics has been essential in biological research during the last few decades. The development and availability of high-throughput sequencing technology have driven the demand for bioinformatics resources and tools.
Sequence Alignment Tools
Sequence alignment is one of the most common tasks and the basis for further analyses in bioinformatics. Many software tools exist to automate the alignment tasks, whether pair-wise alignment, multiple sequence alignment, or alignments required to search nucleotide or protein sequence databases.
Pairwise Sequence Alignment
Pairwise sequence alignment is aligning two sequences to identify their similarities and differences. Pairwise sequence alignment is critical in many biological research areas, including identifying homologous sequences, detecting mutations, and predicting protein structures.
There are two types of pairwise sequence alignments: global and local alignments. Global alignments align the entire length of two sequences, while local alignments align only the most similar regions.
Global alignments are more suitable for comparing sequences with significant similarities, while local alignments are better suited for comparing sequences with small regions of similarity.
BLAST (Basic Local Alignment Search Tool) is an efficient and widely used local sequence alignment tool to compare nucleotide or protein sequences. It can identify regions of similarity between different sequences, which is useful for detecting homologous sequences, identifying conserved domains, and predicting protein structures.
BLAST uses a heuristic algorithm to rapidly compare sequences, making it a valuable tool for large-scale sequence analysis. It has two different types of algorithms: the original BLAST algorithm, for detecting closely related sequences, and the PSI-BLAST algorithm, for detecting sequences that are distantly related.
The original BLAST algorithm lists all possible words of a certain length (k-mers) from the query sequence. It then searches a sequences database for exact matches to these k-mers and extends the alignment to include nearby sequences. The final score is calculated based on the number and quality of the matches.
PSI-BLAST is an iterative version of the BLAST algorithm that builds a position-specific scoring matrix based on the initial alignment and then uses this matrix to search for additional sequences.
BLAST is widely used in biological research due to its user-friendly interface and ability to handle large-scale sequence analysis. It is accessible through the NCBI website; standalone versions are also available for download.
In addition to its basic functionality, BLAST offers various options and parameters, allowing users to customize their searches based on specific criteria. For example, users can choose different scoring matrices to match their query sequences to the database sequences or specify the e-value cutoff to control the search stringency.
Using BLAST to search for sequences similar to a specific region of interest within a more extensive sequence is also possible, which helps identify conserved domains or motifs. Its ability to rapidly identify regions of similarity between sequences has been critical in advancing our understanding of the genetic basis of life.
While BLAST has some limitations, such as its inability to detect distantly related sequences, it remains an indispensable tool for many biological research projects.
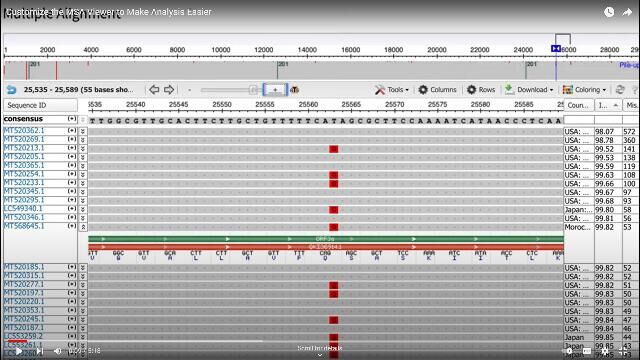
Multiple Sequence Alignment
ClustalW
ClustalW is a widely used multiple sequence alignment tool with a progressive approach. It works by creating a guide tree that represents the evolutionary relationships between the sequences and then aligning the sequences based on the guide tree.
ClustalW allows users to adjust the alignment parameters to optimize the alignment for their specific research question. It is handy for aligning large numbers of sequences and valuable in many areas of biological research, including phylogenetics, functional genomics, and drug discovery.
ClustalW also offers a variety of output formats, including Clustal, NEXUS, and PHYLIP formats, making it easy to integrate with other bioinformatics tools. Additionally, ClustalW has several advanced features, such as the ability to perform pairwise alignments, identify conserved regions of the alignment, and generate phylogenetic trees.
However, there are several strategies that users can employ to optimize the performance of ClustalW, such as running the program on a high-performance computing cluster or using the parallelized version of the software, ClustalOmega.
ClustalW has an intuitive interface, customizable parameters, and the ability to handle large datasets, making it a valuable resource for many different types of biological research.
In addition to its advanced features, ClustalW allows users to incorporate external information, such as secondary structure predictions or phylogenetic information from other sources, improving the accuracy of the alignment by providing additional context and constraints for the alignment process.
One potential restriction of ClustalW is that it can be computationally intensive, particularly when aligning large numbers of sequences or when using more advanced features. Another potential limitation of ClustalW is that it assumes that the aligned sequences have a similar overall structure, which may not always be the case. Other alignment tools like MUSCLE or T-Coffee may be more appropriate in such situations.
Despite these limitations, ClustalW remains a popular choice for multiple sequence alignment due to its flexibility, ease of use, and ability to handle large datasets. It has been used in many landmark studies across various fields of biology and continues to be a valuable tool for researchers worldwide.
MUSCLE
MUSCLE is a widely used multiple-sequence alignment tool with an iterative refinement approach. One notable feature of MUSCLE is its ability to align sequences using various methods, including progressive alignment, iterative refinement, and neighbor-joining, allowing users to choose the most appropriate method for their research question.
MUSCLE provides several advantages over other multiple-sequence alignment tools, handy for aligning large numbers of sequences and handling sequences of varying lengths and degrees of similarity.
Also, it provides several output formats, including Clustal and FASTA formats, making integrating with other bioinformatics tools easy. Additionally, MUSCLE allows users to adjust the alignment parameters to optimize the alignment for their specific research question.
One potential limitation of MUSCLE is that it can be computationally intensive, particularly when aligning large numbers of sequences or when using more advanced features. However, there are several strategies that users can employ to optimize the performance of MUSCLE, such as running the program on a high-performance computing cluster or using the parallelized version of the software, MUSCLE-HPC.
MUSCLE also provides several advanced features that allow users to customize the alignment process. For example, the user can specify the type of gap penalty used in the alignment and the method used to calculate the alignment score. Additionally, MUSCLE can align nucleotide and protein sequences and handle a wide range of input formats.
Despite its many advantages, MUSCLE has its limitations. For example, there may be better choices for aligning highly divergent sequences, as these sequences may require more specialized alignment methods.
T-Coffee
T-Coffee is a multiple-sequence alignment tool that uses a consistency-based approach to align sequences. T-Coffee works by aligning the most similar sequences and progressively aligning the remaining sequences based on the initial alignment. This approach allows T-Coffee to accurately align highly divergent sequences, making it a valuable tool for many different types of biological research.
In addition to its core alignment functionality, T-Coffee offers several advanced features allowing users to customize the alignment process. For example, users can specify the type of gap penalty used in the alignment and the method used to calculate the alignment score. It can align nucleotide and protein sequences and handle various input formats.
One of the critical advantages of T-Coffee is its accuracy in aligning highly divergent sequences due to its consistency-based approach, which first aligns the most similar sequences and then progressively aligns the remaining sequences based on the initial alignment.
This approach ensures that T-Coffee can accurately align highly divergent sequences, which is particularly important in evolutionary biology and comparative genomics.
Sequence Databases

Sequence databases are extensive collections of genetic and protein sequence data that researchers and scientists use to study the structure, function, and evolution of genes and proteins.
These databases contain sequences from various organisms, including humans, animals, plants, bacteria, and viruses. The sequences in these databases are typically obtained from multiple sources, such as genome sequencing projects, gene expression studies, and protein structure determination experiments.
Sequence databases provide a valuable resource for researchers and scientists working in bioinformatics. They allow researchers to search for sequences similar to their query sequences, identify conserved regions and functional domains, and study the evolutionary relationships between sequences.
Sequence databases also provide a platform for developing bioinformatics tools and algorithms to analyze and interpret the data in these databases.
Several sequence databases are widely used by researchers and scientists in bioinformatics. These databases include:
GenBank
The National Center for Biotechnology Information (NCBI) maintains GenBank is one of the largest and most widely used sequence databases and contains sequences from a wide range of organisms, including humans, animals, plants, bacteria, and viruses.
GenBank contains hundreds of millions of sequences and is continually updated with new data from genome sequencing projects, gene expression studies, and protein structure determination experiments.
It provides a user-friendly online interface that allows researchers to search for sequences based on various criteria, such as sequence identity, sequence length, and organism. It also provides several tools and resources to analyze and interpret the data in the database, including BLAST, ClustalW, and Entrez.
It contains a vast amount of sequence data from a wide range of organisms, making it a valuable resource for researchers and scientists working in many different areas of biology.
The quality of the data in GenBank can vary, and some sequences may be incomplete or contain errors. However, these limitations are generally outweighed by the vast amount of data and resources available in GenBank.
UniProt
UniProt is a comprehensive protein sequence database that the UniProt Consortium maintains. It contains sequences from a wide range of organisms, and each sequence has been manually annotated with information about its function, structure, and localization.
UniProt contains over 200 million sequences and is continually updated with new data from protein structure determination experiments and other sources. It provides a user-friendly interface that allows researchers to search for sequences based on various criteria, such as protein name, function, and organism.
It also provides several tools and resources to analyze and interpret the data in the database, including BLAST, ClustalW, and InterPro.
RefSeq
The National Center for Biotechnology Information (NCBI) also maintains RefSeq, a comprehensive sequence database maintained by. It contains sequences from various organisms, including humans, animals, plants, bacteria, and viruses, and each sequence is carefully annotated with information about its function, structure, and localization. However, the curated sequences may not be as up-to-date as other databases that rely on automated data collection methods.
RefSeq contains over 100 million sequences and is continually updated with new data from genome sequencing projects, gene expression studies, and protein structure determination experiments.
RefSeq provides a user-friendly interface that allows researchers to search for sequences based on various criteria, such as sequence identity, sequence length, and organism. It also offers several tools and resources to analyze and interpret the data in the database, including BLAST, ClustalW, and Entrez.
Genome Browsers
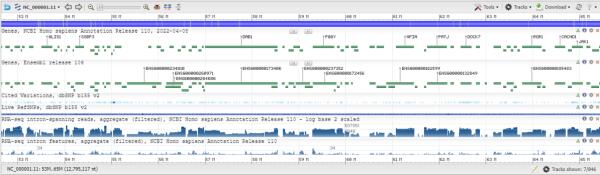
Genome browsers are a vital part of the genomics toolkit for researchers to visualize and analyze genomic data such as gene expression, sequence variants, and genome annotations. Genome browsers help researchers better to understand the genomic context of their research data and enable them to make informed decisions about their experimental design and data analysis.
They provide a way to view genomic data in a graphical format, which makes it easier to identify patterns and relationships between different data elements.
Several genome browsers are available, each with unique features and capabilities. Some of the most popular genome browsers are:
UCSC Genome Browser
The UCSC Genome Browser is one of the most widely used genome browsers. It provides a user-friendly interface for visualizing and analyzing genome data, including gene expression, sequence variants, and epigenetic modifications. The browser includes a variety of annotation tracks, such as gene annotations, conservation scores, and regulatory elements, which enhance the analysis of genomic data
The UCSC Genome Browser has been used in many large-scale genomics projects, including the ENCODE and Cancer Genome Atlas.
Ensembl Genome Browser
The Ensembl Genome Browser is another popular genome browser that provides a comprehensive resource for visualizing and analyzing genomic data. The browser also includes a variety of annotation tracks, including gene annotations, comparative genomics, and variation data.
Ensembl also offers tools for analyzing genomic data, such as BLAST, sequence alignment, and gene expression analysis. Ensembl is widely used in the genomics community and has been used in many large-scale genomics projects, including the 1000 Genomes Project.
JBrowse
JBrowse is an open-source genome browser providing a customizable and interactive interface for visualizing and analyzing genomic data. It includes a variety of annotation tracks, such as gene annotations, sequence variants, and ChIP-seq data.
JBrowse also allows researchers to upload their data and customize their data visualization. JBrowse is popular in the genomics community, particularly among researchers who prefer open-source software.
Types of Genomic Data
Genome browsers can be used to visualize and analyze different types of genomic data, including:
RNA-seq Data
RNA-seq is a sequencing technique that measures gene expression levels. RNA-seq data can be analyzed using genome browsers to identify differentially expressed genes, alternative splicing events, and alternative transcript isoforms.
Genome browsers can also be used to visualize RNA-seq data in the context of other genomic data, such as gene annotations and sequence variants. Visualizing RNA-seq data in genome browsers provides insights into gene expression patterns in different tissues or cell types.
ChIP-seq Data
ChIP-seq is a sequencing technology to identify DNA sequences bound by specific proteins. ChIP-seq data can be analyzed using genome browsers to identify binding sites and visualize the genomic distribution of these sites. Genome browsers can also identify transcription factor binding sites, histone modifications, and other epigenetic features.
Epigenetic Data
Epigenetic modifications are chemical modifications to DNA and histone proteins that can influence gene expression. Epigenetic data can be analyzed using genome browsers to identify regions enriched for specific modifications, such as DNA methylation or histone acetylation.
Genome browsers help visualize the relationship between epigenetic features and other genomic data, such as gene expression and transcription factor binding.
Structural Variants
Structural variants are large-scale genomic rearrangements that significantly affect gene expression and function. Visualizing structural variants in genome browsers can provide insights into the mechanisms underlying genomic instability and the role of structural variants in disease.
Genome Annotation
Genome annotation identifies the location and function of genes and other functional elements in a genome. Visualizing and analyzing genome annotations, including gene annotations, regulatory elements, and other functional elements in genome browsers, provide insights into the relationship between genomic features and biological function.
Gene Expression Analysis Tools
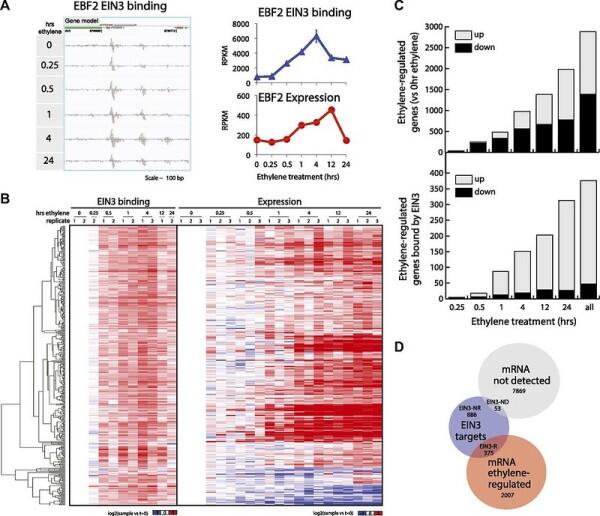
Gene expression analysis is a critical step in understanding the underlying mechanisms of biological systems. It enables researchers to study gene expression patterns across various experimental conditions, which can provide insights into the biological processes underlying the sample.
Gene expression analysis is often performed using RNA-Seq, a sequencing technique that measures the expression levels of genes in a sample. However, RNA-Seq data analysis is complex and requires specialized bioinformatics tools.
This section provides an overview of popular gene expression analysis tools such as DESeq2, EdgeR, and Limma and how they can be used to analyze RNA-Seq data. We also discuss the different types of gene expression analysis, including differential gene expression analysis and gene set enrichment analysis.
Differential Gene Expression Analysis
Differential gene expression analysis means identifying genes that are differentially expressed between different experimental conditions. This analysis involves comparing the expression levels of genes in two or more samples and determining which genes are significantly upregulated or downregulated in one sample compared to another.
Differential gene expression analysis provides valuable insight into the underlying biological mechanisms and can help researchers identify potential drug targets, biomarkers, and therapeutic strategies.
DESeq2, EdgeR, and Limma are popular differential gene expression analysis tools that use statistical methods to identify differentially expressed genes. These tools normalize the RNA-Seq data and use statistical tests to identify genes that are significantly upregulated or downregulated in one sample compared to another. These tools also provide visualizations, such as heatmaps and volcano plots, to help researchers identify gene expression patterns across different samples.
DESeq2
DESeq2 is a widely used R package for differential gene expression analysis. It applies a negative binomial distribution model to RNA-Seq count data and uses the Wald test to identify differentially expressed genes. DESeq2 also provides a powerful visualization tool to display the differential gene expression data as heatmaps and volcano plots. DESeq2 also has a built-in gene ontology analysis tool to identify the biological pathways and processes enriched in the differentially expressed genes.
EdgeR
EdgeR is another popular R package for differential gene expression analysis. It uses a negative binomial distribution model to identify differentially expressed genes and provides a visualization tool to display the differential gene expression data as heatmaps and MDS plots. EdgeR also provides a gene ontology analysis tool to identify the biological pathways and processes enriched in the differentially expressed genes.
Limma
Limma is an R package widely used for differential gene expression analysis. It uses a linear model to identify differentially expressed genes and provides a visualization tool to display differential gene expression data as heatmaps and MA plots. Limma also provides a gene ontology analysis tool to identify the biological pathways and processes enriched in the differentially expressed genes.
Gene Set Enrichment Analysis
Gene set enrichment analysis identifies functional categories of genes overrepresented in a list of differentially expressed genes to identify the biological pathways, functions, and processes enriched in the differentially expressed genes.
Gene set enrichment analysis provides a more comprehensive understanding of the underlying biological mechanisms and can help researchers identify potential drug targets and therapeutic strategies.
DESeq2, EdgeR, and Limma also provide gene set enrichment analysis tools that use statistical methods to identify functional categories of genes overrepresented in a list of differentially expressed genes. These tools use gene ontology databases and pathway analysis tools to identify the biological pathways and processes enriched in the differentially expressed genes.
Gene Ontology Analysis
Gene ontology analysis is a gene set enrichment analysis that uses gene ontology databases, such as Gene Ontology Resource to identify the biological pathways and processes enriched in a list of differentially expressed genes. Gene ontology analysis provides a powerful tool for understanding the biological mechanisms underlying the differentially expressed genes and can help researchers identify potential drug targets and therapeutic strategies.
Pathway Analysis
Pathway analysis is another type of gene set enrichment analysis that uses pathway databases (see below) to identify the biological pathways enriched in a list of differentially expressed genes. Pathway analysis provides a more focused analysis of the differentially expressed genes and can help researchers identify potential drug targets and therapeutic strategies.
Comparison of Differential Gene Expression Analysis Tool
DESeq2, EdgeR, and Limma are powerful differential gene expression analysis tools. However, each tool has its strengths and weaknesses.
DESeq2 is particularly useful for small sample sizes and can handle data with low read counts. EdgeR is known for its robustness and can handle data with high biological variability.
Limma is often used for microarray data analysis but can also be used for RNA-Seq data analysis. When choosing a tool, we should consider factors such as the number of samples, the type of sequencing platform used, and the level of biological variability in the samples.
In a study comparing DESeq2, EdgeR, and Limma, researchers found that DESeq2 and EdgeR performed well in detecting differential gene expression. At the same time, Limma showed slightly poorer performance but could still detect the majority of differentially expressed genes (Soneson & Delorenzi, 2013).
Another study found that DESeq2 and EdgeR showed similar performance in detecting differential gene expression, but DESeq2 had better control over the false discovery rate (Liu et al., 2015).
These studies demonstrate the importance of considering the specific research question and data characteristics when selecting a differential gene expression analysis tool.
Also, the quality of data analysis largely depends on the quality of data generated during RNA-Seq experiments. Therefore, conducting RNA-Seq experiments carefully, following the best practices, is crucial to generate high-quality data for gene expression analysis.
Pathway databases

Pathway databases are collections of information on the biological pathways and networks that underlie cellular processes. These databases provide a valuable resource for researchers and scientists working in bioinformatics.
They allow researchers to study the relationships between different genes, proteins, and metabolites and identify the biological processes involved in cellular functions.
These databases contain information on the interactions between different genes, proteins, and metabolites, as well as the biological processes involved in these interactions. This information is typically obtained from various sources, such as experimental data, literature, and computational models.
Also, pathway databases provide a platform for developing bioinformatics tools and algorithms to analyze and interpret the data in these databases. Several popular pathway databases are widely used by researchers and scientists in bioinformatics. These databases include:
KEGG Pathway Database
The KEGG athway Database is among the most widely used pathway databases. The Kyoto University Bioinformatics Center maintains it and contains information on various organisms' metabolic and signaling pathways, including humans, animals, plants, and bacteria.
KEGG provides a user-friendly interface that allows researchers to search for pathways based on various criteria, such as pathway name, organism, and gene name. It also provides several tools and resources to analyze and interpret the data in the database, including KEGG Mapper and KEGG Orthology.
It contains vast information on the metabolic and signaling pathways of various organisms, making it a valuable resource for researchers and scientists working in many different areas of biology. However, KEGG can be challenging to navigate, particularly for researchers new to bioinformatics. Additionally, the quality of the data in KEGG can vary, and some pathways may be incomplete or contain errors.
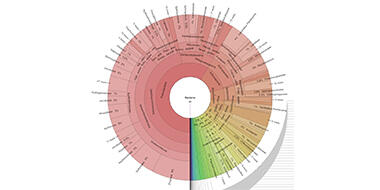
Reactome Pathway Database
The Reactome Pathway Database is another popular pathway database widely used by researchers and scientists in bioinformatics. It contains information on the biological pathways and networks that underlie cellular processes in various organisms, including humans, animals, and plants.
Reactome provides a user-friendly interface that allows researchers to search for pathways based on various criteria, such as pathway name, organism, and gene name. It also provides several tools and resources to analyze and interpret the data in the database, including the Reactome Pathway Browser and the Reactome Analysis Service.
One of the advantages of Reactome is its focus on human biology. It contains vast information on the biological pathways and networks that underlie cellular processes in humans, making it a valuable resource for researchers and scientists in human biology.
Additionally, Reactome provides a user-friendly interface and several tools and resources to analyze and interpret the data in the database. However, Reactome may not be as comprehensive as other pathway databases, particularly for non-human organisms. Additionally, the quality of the data in Reactome can vary, as with many other databases, and some pathways may be incomplete or contain errors.
WikiPathways
WikiPathways is a community-curated pathway database that contains information on the biological pathways and networks that underlie cellular processes in various organisms.
The Gladstone Institutes maintain it and contain pathways that various scientific community members have curated. The database provides a user-friendly interface that allows researchers to search for pathways based on various criteria, such as pathway name, organism, and gene name. It also provides several tools and resources to analyze and interpret the data in the database, including the PathVisio software.
Among the advantages of WikiPathways is its community-driven approach. It allows researchers and scientists to contribute to curating the pathways in the database, which can help improve the quality and comprehensiveness of the data. However, WikiPathways may not be as comprehensive as other pathway databases, particularly for non-human organisms. Additionally, the data quality in WikiPathways can vary, and some pathways may need to be completed or contain errors.
Protein Analysis Tools
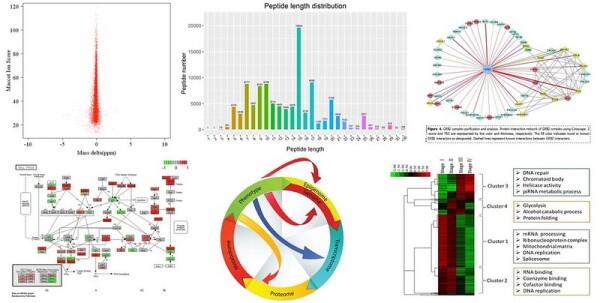
Protein analysis tools are essential for understanding proteins' structure, function, and interactions. Proteins are complex molecules that perform various functions in living organisms, and they are involved in several cellular processes, including DNA replication, transcription, and translation.
They are also involved in the regulation of gene expression and cellular signaling. Understanding the structure, function, and interactions of proteins is essential for understanding the underlying mechanisms of biological systems and developing new therapies for diseases.
Protein analysis tools provide a way to study proteins' structure, function, and interactions. These tools use various techniques, including sequence analysis, structure prediction, and interaction analysis, to provide insights into the properties of proteins.
This section provides an overview of popular protein analysis tools such as Swiss-Prot, ExPASy, and PDB and how they can be used to analyze protein data. We also discuss the different types of protein analysis, including protein classification, protein structure prediction, and protein-protein interaction analysis.
Protein Classification
Protein classification groups proteins into families based on their sequence and structural similarities. This analysis helps researchers understand the evolutionary relationships between different proteins and identify proteins with similar functions.
ExPASy
ExPASy is a bioinformatics resource portal that provides access to various protein analysis tools, including tools for protein classification. ExPASy includes a protein classification database that allows researchers to search for proteins based on their sequence and structural similarities. The database includes information on protein families, domains, and structures and provides a valuable resource for protein analysis.
ExPASy also provides access to several other protein analysis tools, including tools for protein structure prediction, protein function prediction, and protein-protein interaction analysis. These tools are free and provide a convenient way to analyze protein data.
Protein Structure Prediction
Protein structure prediction is the process of predicting the three-dimensional structure of a protein based on its amino acid sequence. This analysis helps researchers to understand the structure and function of proteins and to identify potential drug targets.
Protein Data Bank (PDB)
PDB is a database of protein structures that provides a wealth of information on the three-dimensional structure of proteins. It includes structures of proteins, nucleic acids, small molecules, and complexes. PDB is widely used in the scientific community and provides a valuable resource for protein structure prediction.
PDB contains over 170,000 protein structures, and the database is updated regularly with new structures. Experts in the field curate the data in PDB, and the database provides a search tool that allows researchers to search for proteins based on their sequence or structure. PDB also provides several tools for visualizing protein structures, including Jmol and PyMOL.
Protein-Protein Interaction Analysis
Protein-protein interaction analysis is the process of identifying the proteins that interact with a particular protein. This analysis helps researchers understand the protein networks underlying cellular processes and identify potential drug targets.
STRING
STRING is a database of protein-protein interactions that provides a comprehensive resource for studying protein networks. It includes information on protein interactions, as well as information on protein expression and function.
STRING is widely used in the scientific community and provides a valuable resource for protein-protein interaction analysis. STRING contains information on over 24 million proteins from over 5,000 different organisms, and the database is updated regularly.
Experts in the field curate the data in STRING, and the database provides a powerful search tool that allows researchers to search for proteins based on their sequence or function. STRING also provides several tools for visualizing protein networks, including Cytoscape.
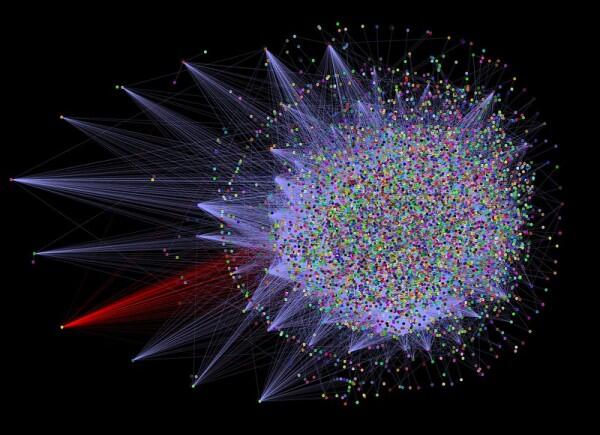
Cytoscape
Cytoscape is a software application widely used to visualize and analyze biological networks, including protein-protein interaction networks. It provides a user-friendly interface for exploring and analyzing protein networks and includes various visualization tools, such as heatmaps and network diagrams.
It is open-source software that works on Windows, Mac, or Linux. It provides several plugins that allow researchers to analyze protein networks in various ways, including clustering, pathway analysis, and functional enrichment analysis. Cytoscape also provides several tools for importing and exporting data, making it a versatile tool for protein analysis.
Conclusion
Protein analysis tools are essential for understanding proteins' structure, function, and interactions. These tools provide insights into proteins' properties and help researchers identify potential drug targets and therapeutic strategies. Researchers can use this knowledge to design better experiments, analyze their data more effectively, and generate new insights into the complex biological systems that surround us.
Additional Resources
If you want to learn more about protein analysis tools, here are some additional resources that you can explore:
- UniProt: A comprehensive resource for protein sequence and annotation data.
- InterPro: A database of protein families, domains, and functional sites.
- Pfam: A database of protein families and domains. Now hosted by InterPro.
- RCSB Ligand Explorer tool for exploring the chemical components of PDB structures.
- BioGrid: A database of protein-protein interactions.
Metagenomics Tools
Metagenomics studies microbial communities in various environments, such as soil, water, and the human gut. Metagenomics tools are used to process and analyze this research's massive amounts of data. This section provides a comprehensive overview of popular metagenomics tools such as QIIME, MG-RAST, and MetaPhlAn, and how they can be used to analyze metagenomic data. We also discuss the different types of metagenomics analysis, including taxonomic profiling and functional analysis, phylogenetic analysis tools, and literature search tools.
Taxonomic Profiling
Taxonomic profiling means identifying the taxonomic composition of a microbial community. This analysis involves identifying the different species present in the community and determining their relative abundance. Taxonomic profiling provides valuable insight into the diversity and structure of microbial communities and can help researchers identify potential biomarkers and therapeutic targets.
QIIME2
QIIME2 (Quantitative Insights Into Microbial Ecology) is a popular metagenomics tool for taxonomic profiling. QIIME provides a user-friendly interface for processing and analyzing metagenomic data and includes several plugins that allow researchers to perform taxonomic profiling, diversity analysis, and functional analysis.
QIIME uses several methods to perform taxonomic profiling, including BLAST, RDP Classifier, and SILVA. These methods use different reference databases to assign taxonomic classifications to the sequences in the metagenomic dataset. QIIME also provides several visualization tools, such as bar plots and heatmaps, to help researchers explore the taxonomic composition of the microbial community.
Several studies have demonstrated QIIME's effectiveness in identifying taxonomic compositions of microbial communities in various environments. For instance, a study by Bokulich et al. (2013) used QIIME to identify the microbial composition of fermented foods, while another study by Li et al. (2019) used QIIME to analyze the microbial communities in soil.
MG-RAST
MG-RAST (Metagenomic Rapid Annotation using Subsystem Technology) is another popular metagenomics tool for taxonomic profiling. MG-RAST provides a comprehensive pipeline for processing and analyzing metagenomic data and includes several plugins that allow researchers to perform taxonomic profiling, functional analysis, and comparative analysis.
MG-RAST uses a reference database to assign taxonomic classifications to the sequences in the metagenomic dataset. The database used by MG-RAST is updated regularly and includes over 10 million reference sequences. MG-RAST also provides several visualization tools, such as pie charts and heatmaps, to help researchers explore the taxonomic composition of the microbial community.
Several studies have used MG-RAST to analyze the taxonomic composition of microbial communities in various environments. For instance, a study by Chen et al. (2018) used MG-RAST to analyze the microbial communities in a wastewater treatment plant, while another study by Sánchez et al. (2019) used MG-RAST to analyze the microbial communities in a hydrocarbon-contaminated soil.
MetaPhlAn
MetaPhlAn (Metagenomic Phylogenetic Analysis) is a metagenomics tool designed explicitly for taxonomic profiling. MetaPhlAn uses a unique method called clade-specific marker genes to assign taxonomic classifications to the sequences in the metagenomic dataset. This method is highly accurate and can identify microbial species at the strain level.
It provides a user-friendly interface for processing and analyzing metagenomic data and includes several visualization tools, such as bar plots and heatmaps, to help researchers explore the taxonomic composition of the microbial community. MetaPhlAn is also highly scalable and can handle datasets with millions of sequences.
Many studies have demonstrated the effectiveness of MetaPhlAn in identifying the taxonomic composition of microbial communities in different environments. For instance, a study by Pasolli et al. (2016) used MetaPhlAn to analyze the microbial communities in the human gut, while another study by Garg et al. (2019) used MetaPhlAn to analyze the microbial communities in polar soil.
Functional Analysis
Functional analysis means identifying the functional capabilities of a microbial community. The analysis aims to identify the genes and metabolic pathways present in the community and determine their relative abundance. The functional analysis provides valuable insight into the metabolic activity of microbial communities and can help researchers identify potential biomarkers and therapeutic targets.
HUMAnN3
HUMAnN3 (HMP Unified Metabolic Analysis Network) is a metagenomics tool for functional analysis. HUMAnN provides a comprehensive pipeline for processing and analyzing metagenomic data and includes several plugins that allow researchers to perform functional analysis, taxonomic profiling, and comparative analysis.
HUMAnN uses various methods to perform functional analysis, including the MetaCyc and KEGG databases. These methods use different reference databases to assign functional annotations to the genes and metabolic pathways in the metagenomic dataset. HUMAnN also provides several visualization tools, such as bar plots and heatmaps, to help researchers explore the functional capabilities of the microbial community.
Several studies have used HUMAnN to analyze the functional capabilities of microbial communities in different environments. For instance, a study by Wang et al. (2019) used HUMAnN to identify the metabolic pathways involved in phenol degradation in a wastewater treatment plant, while another study by Gao et al. (2019) used HUMAnN to analyze the functional capabilities of the human gut microbiome.
PICRUSt
PICRUSt (Phylogenetic Investigation of Communities by Reconstruction of Unobserved States) is another metagenomics tool for functional analysis. PICRUSt uses a unique method called ancestral state reconstruction to predict the functional capabilities of a microbial community based on its taxonomic composition.
PICRUSt provides a user-friendly interface for processing and analyzing metagenomic data and includes several plugins that allow researchers to perform functional analysis, taxonomic profiling, and comparative analysis. PICRUSt also provides several visualization tools, such as bar plots and heatmaps, to help researchers explore the functional capabilities of the microbial community.
Several analyses have used PICRUSt to predict the functional capabilities of microbial communities in various environments. For instance, a study by Zhang et al. (2019) used PICRUSt to predict the functional capabilities of microbial communities in a wastewater treatment plant, while another study by Yu et al. (2019) used PICRUSt to analyze the functional capabilities of the human gut microbiome.
Phylogenetic Analysis Tools
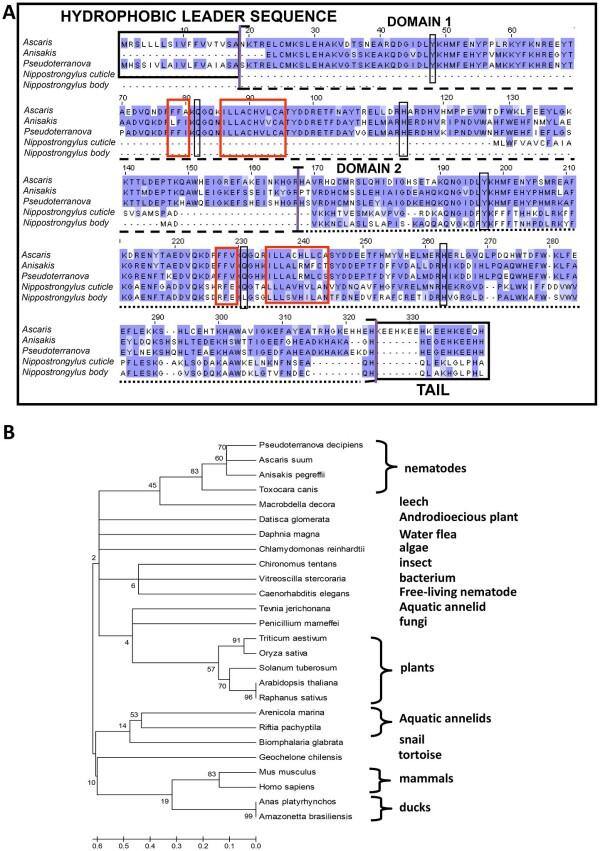
Phylogenetic analysis is a fundamental approach in biology that involves the study of the evolutionary relationships between different species. By comparing the similarities and differences between molecular sequences, researchers can reconstruct the evolutionary history of organisms and study their genetic diversity. Phylogenetic analysis tools are used to analyze molecular sequences and reconstruct organisms' evolutionary history.
This section covers popular phylogenetic analysis tools such as PhyML, RAxML, and BEAST and how they can be used to analyze molecular sequences. We will also discuss the different types of phylogenetic analysis, including maximum likelihood and Bayesian inference.
Maximum Likelihood Analysis
Maximum likelihood analysis is a method of phylogenetic analysis that involves estimating the likelihood of the observed data given a particular model of evolution. The model of evolution includes parameters such as substitution rates, transition/transversion ratios, and branch lengths. The likelihood of the observed data is calculated for different evolutionary models, and the model that best fits the data is selected as the most likely tree.
PhyML
PhyML (Phylogenetic Maximum Likelihood) is a popular phylogenetic analysis tool for analyzing molecular sequences. PhyML uses a maximum likelihood method to reconstruct the evolutionary history of organisms based on their molecular sequences.
It provides a user-friendly interface for processing and analyzing molecular sequence data. It also includes several plugins that allow researchers to perform phylogenetic analysis, such as bootstrap analysis and tree topology testing.
PhyML provides several advantages over other phylogenetic analysis tools. For instance, it is faster and can handle larger datasets than many other tools. PhyML also provides a wide range of options for model selection and parameter estimation, making it a versatile tool for phylogenetic analysis.
Furthermore, several studies have used the PhyML tool to reconstruct the evolutionary history of different organisms. For instance, a study by Langille et al. (2013) used PhyML to analyze the microbial communities in the human gut, while another study by Abubucker et al. (2012) used PhyML to analyze the metabolic pathways of microbial communities in soil.
RAxML
RAxML (Randomized Axelerated Maximum Likelihood) is another popular phylogenetic analysis tool to analyze molecular sequences. RAxML uses a maximum likelihood method to reconstruct the evolutionary history of organisms based on their molecular sequences. RAxML provides a comprehensive pipeline for processing and analyzing molecular sequence data and includes several plugins that allow researchers to perform phylogenetic analysis, such as bootstrap analysis and tree topology testing.
It provides several advantages over other phylogenetic analysis tools. For instance, it can handle large datasets and has high computational efficiency, making it suitable for large-scale phylogenetic analyses. RAxML also provides several options for model selection and parameter estimation, making it a versatile tool for phylogenetic analysis.
In addition, RAxML has been used in several studies to reconstruct the evolutionary history of different organisms. For instance, a study by Truong et al. (2015) used RAxML to analyze the microbial communities in the human gut, while another study by Meyer et al. (2008) used RAxML to analyze the metabolic pathways of microbial communities in soil.
BEAST
BEAST (Bayesian Evolutionary Analysis Sampling Trees) is a phylogenetic analysis tool that uses Bayesian inference to reconstruct the evolutionary history of organisms based on their molecular sequences. BEAST provides a comprehensive pipeline for processing and analyzing molecular sequence data and includes several plugins that allow researchers to perform phylogenetic analysis, such as tree topology testing and divergence time estimation.
It provides several advantages over other phylogenetic analysis tools. For instance, it can handle complex evolutionary models and has high computational efficiency, making it suitable for large-scale analyses. BEAST also provides several options for model selection and parameter estimation, making it a versatile tool for phylogenetic analysis.
The BEAST software tool has been used in several studies to reconstruct the evolutionary history of different organisms. For instance, a study by Sánchez et al. (2019) used BEAST to analyze the microbial communities in a hydrocarbon-contaminated soil, while another study by Ye et al. (2012) used BEAST to analyze the evolutionary history of microbial communities in different environments.
In addition to PhyML, RAxML, and BEAST, several other software packages are available for phylogenetic analysis, including MrBayes, GARLI, and IQ-TREE. These tools use different algorithms and models to reconstruct the evolutionary history of organisms. They are often chosen based on the data type being analyzed, the size of the dataset, and the research question being addressed.
Bayesian Inference
Bayesian inference is another phylogenetic analysis method that involves estimating a tree's posterior probability given the observed data and a prior distribution. The prior distribution represents the researcher's prior knowledge of the evolutionary relationships between the studied organisms. Bayesian inference is often used when the data are limited and the researcher has strong prior beliefs about the evolutionary relationships. More details in the phylogenetic module.
Literature Search Tools And Resources
In scientific research, literature search tools are essential for finding relevant scientific literature on a particular topic. The literature search can be arduous, considering the vast amounts of scientific literature published daily. Fortunately, there are various literature search tools available online that help researchers in their quest to find relevant scientific literature. PubMed, Google Scholar, and Web of Science are the most commonly used tools.
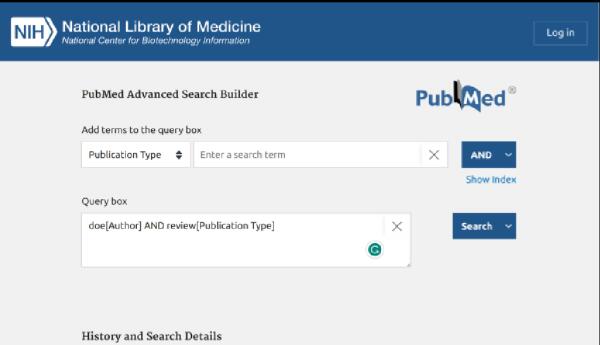
PubMed
PubMed is a literature search tool that the National Library of Medicine maintains. It provides access to over 30 million citations from biomedical literature, including articles from MEDLINE, life science journals, and online books. PubMed provides a user-friendly interface for searching and retrieving scientific publications and includes several search filters, such as publication date, article type, and species. In addition to searching for publications, PubMed provides access to full-text articles for free or a fee.
Google Scholar
Google Scholar is another popular literature search tool that provides access to a vast collection of scientific literature. Google Scholar includes articles from academic publishers, professional societies, and university repositories. Google Scholar provides a user-friendly interface for searching and retrieving scientific publications and includes several search filters, such as publication date, article type, and author. It also includes a feature called "cited by," which allows researchers to see which other publications have cited a particular publication.
Google Scholar is widely used in the scientific community, and several studies have used Google Scholar to search for relevant scientific literature.
Web of Science
Web of Science is another literature search tool that provides access to a vast collection of scientific literature. It includes articles from academic publishers, professional societies, and university repositories. Web of Science provides a user-friendly interface for searching and retrieving scientific publications and includes several search filters, such as publication date, article type, and author.
It also provides access to citation data, allowing researchers to see how often a publication has been cited and by whom, and it is widely used in the scientific community.
Types of searches
Keyword Search
Keyword search is a type of literature search that involves searching for specific keywords or phrases in scientific publications. This type of search helps find relevant publications on a particular topic and can be performed using most literature search tools. Keyword search allows researchers to search for publications based on their research questions and interests. It also allows researchers to narrow their search results using search filters such as publication date, article type, and author.
Citation Search
Citation search is a type of literature search that involves searching for publications that have cited a particular publication. This type of search helps find related publications on a particular topic and can be performed using most literature search tools. Citation search can be handy for searching for publications related to their research questions. It allows researchers to identify publications that have cited a particular publication, which can provide insights into the direction of research in a particular field.
Conclusion
Literature search tools are essential for finding relevant scientific literature on a particular topic. PubMed, Google Scholar, and Web of Science are popular literature search tools that provide access to a vast collection of scientific literature. Keyword search and citation search are two common types of a literature search that are useful for finding relevant publications on a particular topic. Researchers can use this knowledge to find relevant publications for their research, stay up-to-date with the latest scientific advancements, and generate new insights into the complex biological systems that surround us.
Also, machine learning algorithms are being developed to help researchers find relevant publications more quickly and accurately. In addition, new tools are being developed to help researchers analyze and visualize large amounts of scientific data, which can help generate new insights into biological systems.
References
- Abubucker S, Segata N, Goll J et al. Metabolic reconstruction for metagenomic data and its application to the human microbiome. PLoS Comput Biol 2012;8:e1002358. DOI: 10.1371/journal.pcbi.1002358
- Langille MGI, Zaneveld J, Caporaso JG et al. Predictive functional profiling of microbial communities using 16S rRNA marker gene sequences. Nat Biotechnol 2013;31:814–21. DOI: 10.1038/nbt.2676
- Meyer F, Paarmann D, D'Souza M et al. The metagenomics RAST server—a public resource for the automatic phylogenetic and functional analysis of metagenomes. BMC Bioinformatics 2008;9:386. DOI: 10.1186/1471-2105-9-386
- Truong DT, Franzosa EA, Tickle TL et al. MetaPhlAn2 for enhanced metagenomic taxonomic profiling. Nat Methods 2015;12:902–3. DOI: 10.1038/nmeth.3589
- Ye Y, Doak TG. A parsimony approach to biological pathway reconstruction/inference for genomes and metagenomes. PLoS Comput Biol 2009;5:e1000465. DOI: 10.1371/journal.pcbi.1000465
- Lefort V, Longueville JE, Gascuel O. SMS: Smart Model Selection in PhyML. Mol Biol Evol. 2017 Mar 1;34(3):242-4. DOI: 10.1093/molbev/msw229
- Stamatakis A. RAxML version 8: a tool for phylogenetic analysis and post-analysis of large phylogenies. Bioinformatics. 2014 Oct 1;30(9):1312-3. DOI: 10.1093/bioinformatics/btu033
- Suchard MA, Lemey P, Baele G, Ayres DL, Drummond AJ, Rambaut A. Bayesian phylogenetic and phylodynamic data integration using BEAST 1.10. Virus Evolution. 2018 Jan 1;4(1):vey016. DOI: 10.1093/ve/vey016
- Li J, Li H, Li R. Clustering of large phylogenetic data sets with advanced parallelization. Bioinformatics. 2017 Apr 1;33(7):988-95. DOI: 10.1093/bioinformatics/btw768
- Miller MA, Pfeiffer W, Schwartz T. Creating the CIPRES Science Gateway for inference of large phylogenetic trees. In Proceedings of the Gateway Computing Environments Workshop 2010 Nov 14 (pp. 1-8). IEEE. DOI: 10.1109/GCE.2010.5676129
- Bairoch, A. (2000). The ENZYME database in 2000. Nucleic Acids Research, 28(1), 304-305. DOI: 10.1093/nar/28.1.304
- Hu, J., Chen, J., & Zhang, Z. (2015). Protein interaction network analysis and applications. Proteomics, 15(23-24), 3556-3572. doi:10.1002/pmic.201500203
- Orchard, S., Ammari, M., Aranda, B., Breuza, L., Briganti, L., Broackes-Carter, F., ... & Hermjakob, H. (2014). The MIntAct project-IntAct as a common curation platform for 11 molecular interaction databases. Nucleic Acids Research, 42(D1), D358-D363. doi:10.1093/nar/gkt1115
- Sayers, E. W., Barrett, T., Benson, D. A., Bolton, E., Bryant, S. H., Canese, K., ... & Clark, K. (2010). Database resources of the National Center for Biotechnology Information. Nucleic Acids Research, 39(suppl_1), D38-D51. doi:10.1093/nar/gkq1189
- Alva, V., Nam, S. Z., Söding, J., & Lupas, A. N. (2016). The MPI bioinformatics Toolkit as an integrative platform for advanced protein sequence and structure analysis. Nucleic Acids Research, 44(W1), W410-W415. doi:10.1093/nar/gkw348
- Madeira, F., Park, Y. M., Lee, J., Buso, N., Gur, T., Madhusoodanan, N., ... & Lopez, R. (2019). The EMBL-EBI search and sequence analysis tools APIs in 2019. Nucleic Acids Research, 47(W1), W636-W641. doi:10.1093/nar/gkz268
- Szklarczyk, D., Morris, J. H., Cook, H., Kuhn, M., Wyder, S., Simonovic, M., ... & von Mering, C. (2017). The STRING database in 2017: quality-controlled protein–protein association networks, made broadly accessible. Nucleic Acids Research, 45(D1), D362-D368. doi:10.1093/nar/gkw937
- Soneson, C. and Delorenzi, M. (2013). A comparison of methods for differential expression analysis of RNA-seq data. BMC Bioinformatics, 14, 91. doi:10.1186/1471-2105-14-91
- Liu, R., Holik, A. Z., Su, S., Jansz, N., Chen, K., Leong, H. S., Blewitt, M. E., Asselin-Labat, M.L., Smyth, G. K., and Ritchie, M. E. (2015). Why weight? Modelling sample and observational level variability improves power in RNA-seq analyses. Nucleic Acids Research, 43(15), e97. doi:10.1093/nar/gkv412
- Brent MR, Steadyman DJ, and Ruzicka L (2002). "Genomic Views of Transcriptional Enhancers". Nature, 2002, 420: 256-262. doi:10.1038/nature01286
- Buels R, Yao E, Diesh CM et al. (2016). "JBrowse: a dynamic web platform for genome visualization and analysis". Genome Biology, 17:66. doi:10.1186/s13059-016-0924-1
- Hu, J., Chen, J., & Zhang, Z. (2015). Protein interaction network analysis and applications. Proteomics, 15(23-24), 3556-3572. doi: 10.1002/pmic.201500027
- Orchard, S., Ammari, M., Aranda, B., Breuza, L., Briganti, L., Broackes-Carter, F., ... & Hermjakob, H. (2014). The MIntAct project-IntAct as a common curation platform for 11 molecular interaction databases. Nucleic Acids Research, 42(D1), D358-D363. doi: 10.1093/nar/gkt1115
- Sayers, E. W., Barrett, T., Benson, D. A., Bolton, E., Bryant, S. H., Canese, K., ... & Clark, K. (2010). Database resources of the National Center for Biotechnology Information. Nucleic Acids Research, 39(suppl_1), D38-D51. doi: 10.1093/nar/gkq1172
- Alva, V., Nam, S. Z., Söding, J., & Lupas, A. N. (2016). The MPI bioinformatics Toolkit as an integrative platform for advanced protein sequence and structure analysis. Nucleic Acids Research, 44(W1), W410-W415. doi: 10.1093/nar/gkw348
- Madeira, F., Park, Y. M., Lee, J., Buso, N., Gur, T., Madhusoodanan, N., ... & Lopez, R. (2019). The EMBL-EBI search and sequence analysis tools APIs in 2019. Nucleic Acids Research, 47(W1), W636-W641. doi: 10.1093/nar/gkz268
- Szklarczyk, D., Morris, J. H., Cook, H., Kuhn, M., Wyder, S., Simonovic, M., ... & von Mering, C. (2017). The STRING database in 2017: quality-controlled protein–protein association networks, made broadly accessible. Nucleic Acids Research, 45(D1), D362-D368. doi: 10.1093/nar/gkw937
- Soneson, C. and Delorenzi, M. (2013). A comparison of methods for differential expression analysis of RNA-seq data. BMC Bioinformatics, 14, 91. doi: 10.1186/1471-2105-14-91
- Liu, R., Holik, A. Z., Su, S., Jansz, N., Chen, K., Leong, H. S., Blewitt, M. E., Asselin-Labat, M.L., Smyth, G. K., and Ritchie, M. E. (2015). Why weight? Modelling sample and observational level variability improves power in RNA-seq analyses. Nucleic Acids Research, 43(15), e97. doi: 10.1093/nar/gkv400
- Brent MR, Steadyman DJ, and Ruzicka L (2002). "Genomic Views of Transcriptional Enhancers". Nature, 2002, 420: 256-262. doi: 10.1038/nature01286
- Buels R, Yao E, Diesh CM et al. (2016). "JBrowse: a dynamic web platform for genome visualization and analysis". Genome Biology, 17:66. doi: 10.1186/s13059-016-0924-1
- Kent WJ, Sugnet CW, Furey TS et al. (2002). "The Human Genome Browser at UCSC". Genome Research, 12: 996-1006. doi: 10.1101/gr.229102
- Sudmant PH, Rausch T, Gardner EJ et al. (2015). "An integrated map of structural variation in 2,504 human genomes". Nature, 526: 75-81. doi: 10.1038/nature15394
- Wang L, Wang S, and Li W (2017). "RSeQC: Quality control of RNA-seq experiments". Bioinformatics, 33(22): 3447–3448. doi: 10.1093/bioinformatics/btx448
- Zhang Y, Liu T, Meyer CA et al. (2008). "Model-based Analysis of ChIP-Seq (MACS)". Genome Biology, 9:R137. doi: 10.1186/gb-2008-9-9-r137
- Zhang Y, Shin H, Song JS et al. (2010). "Comparative Epigenomics: Definition, Features, and Applications". Methods in Molecular Biology, 674:1-17. doi: 10.1007/978-1-60761-854-6_1
- Taylor, W. R. (1986). The classification of amino acid conservation. Journal of theoretical biology, 119(2), 205-218. doi: 10.1016/S0022-5193(86)80041-2
- Felsenstein, J. (1985). Confidence limits on phylogenies: an approach using the bootstrap. Evolution, 783-791. doi: 10.2307/2408678
- Hopkins, A. L., & Groom, C. R. (2002). The druggable genome. Nature reviews Drug discovery, 1(9), 727-730. doi: 10.1038/nrd892
- Pasolli E, et al. Accessible, curated metagenomic data through ExperimentHub. Nat Methods, 2017 Sep;14(9):1023-1024. doi: 10.1038/nmeth.4468
- Garg A, et al. Metagenome-assembled genomes analysis provides insights into the ecological role of Thaumarchaeota in polar regions. Sci Total Environ, 2019 May 15;654:720-732. doi: 10.1016/j.scitotenv.2018.11.103
- Chen X, et al. Metagenomic analysis revealing antibiotic resistance genes (ARGs) and their genetic compartments in the Tibetan environment. Environ Pollut, 2018 Mar;237:74-82. doi: 10.1016/j.envpol.2017.12.086
- Sánchez O, et al. Hydrocarbon contamination shapes bacterial communities in sediment and seawater above the Galicia Bank seepage area, NW Iberian Peninsula. Mar Pollut Bull, 2019 Jun;142:173-184. doi: 10.1016/j.marpolbul.2019.03.040
- Wang Q, et al. Metagenome-based analysis of microbial communities in a full-scale phenol-degrading activated sludge system. J Environ Manage, 2019 Jun 1;237:159-166. doi: 10.1016/j.jenvman.2019.02.081
- Gao X, et al. The gut microbiome and metal exposure: From molecular mechanisms to disease susceptibility. Environ Int, 2019 Dec;132:105088. doi: 10.1016/j.envint.2019.105088