Please, update your bookmark.
Tutorial: Genome assembly Quality Metrics

Objectives:
To give fundamental knowledge of methods on 1. how to check the quality and completeness of sequence assemblies. 2. How to detect errors in sequence assemblies.
Introduction
Genome assembly is a difficult and yet unsolved problem. Sequence assembly tools must solve many challenging subproblems. For example, multiple-sequence alignment (MSA) and finding paths in graphs.
MSA is NP-complete and finding paths in graphs an NP-hard problem. It is not possible optimally solve an NP-complete problem. Although not proven but nobody has managed with that feat yet.
The current sequencing technologies can only produce short reads compared to chromosome lengths. This is the main reason why we need assembly programs in the first place.
The short read lengths, in turn, present a challenge to reconstruct a genome. The foremost reasons are sequence repeats, sequencing errors, incomplete coverage, and heterozygosity. Read more about this topic at Complications in Fragment Assembly.
A sequence assembly can go wrong in many ways. Thus, we must assess both the correctness and completeness of an assembly. We go through the most common assembly quality metrics.
Short repeat distribution
Genomic repeats that are longer than the read length complicate the assembly (Figure 1.). It is a good idea to assess the repeat content before the assembly stage. The analysis is also useful for the assessment of the quality of an assembly.

We can use k-mers (reads of length k) to estimate biases, repeat content, sequencing coverage, and heterozygosity.
A few tools exist that compute various statistics using k-mers, such as KmerGenie (5) and GenomeScope (6). GenomeScope is also available online: http://qb.cshl.edu/genomescope/.
Most of the time we need to improve the first draft assemblies. To get an idea of how close to the true genome sequence the draft assembly is, we can compare it with the experimentally estimated size. It is also possible to computationally estimate the size of a genome using k-mer distributions but that is beyond the scope of this tutorial.
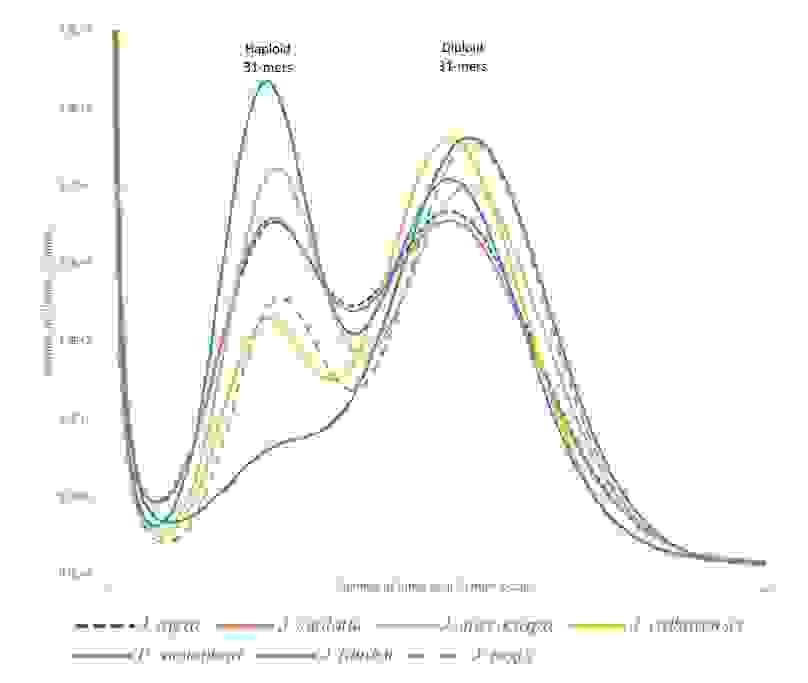
It always a good idea to plot varied k-mer frequencies to get a picture of the genome composition. For example, haploid and diploid genomes have differing k-mer distributions (Figure 2.).

Contig and scaffold length distribution
In the perfect world, a genome assembly results in a single contig for a haploid chromosome and in two contigs for a diploid chromosome. Unfortunately, we don’t live in a perfect world; Thus, assemblies tend to come out in many smaller contigs with varied lengths.
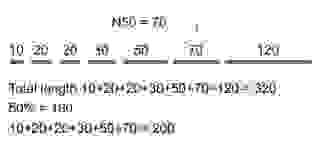
The most common statistic for the analysis of contig lengths is N50. It tells us what is the least length of contigs that cover at least half of the genome. Often an accurate estimation of the genome size is not available but we can use the total length of the contigs instead.
We compute the N50 by first ordering all the contigs in ascending order starting from the shortest. Next, starting from the shortest contig, we add up the length of each one until we reach a value that is equal to or greater than 50% of the total length of all the contigs. That value is N50 (Figure 3.).

Another common metric is N90, computed as N50 but the ‘cutoff’ is 90% of the total genome length. So, N90-length is the smallest length of contigs that cover at least 90% of the genome. Various other statistics exist, although not as common as N50 and N90. See related statistics on Wikipedia.
The REAPR tool (Recognition of Errors in Assemblies using Paired Reads) computes a “corrected” N50 metric. The input is an assembly file in FASTA format and a BAM file containing paired-end read mapped to the assembly. The tool computes scores for base accuracy, detects locations of incorrect assemblies and uses the information to compute the “corrected” N50 value. You can download the tool at https://www.sanger.ac.uk.
R code for computing N50
It is very easy to use R to compute N50. We can write the following function:
Documentation for APE library and read.dna.Presence of conserved genes
Plotting contig or scaffold length distributions and computing N50 or other N-values are informative but more we should not only rely on those statistics.
A well-established method to quantify the completeness of genome assemblies is by assessing the gene content. We can use the information, for example, to pinpoint assembly problems and to improve assemblies by targeting the problematic regions.
BUSCO (Benchmarking Universal Single-Copy Orthologs) is a tool that uses datasets from OrthoDB to assess the completeness of genome and transcriptome assemblies. It uses protein-coding orthologous genes present as single-copies in at least 90% of the species.
The BUSCO tool has datasets for vertebrates, arthropods, fungi, nematodes, plants, protists, and prokaryotes.
The core idea is that if BUSCO fails to identify genes in an assembly, it is a sign of an incomplete assembly. Also, if more than a single copy is present, it is a sign of duplication produced by an assembly program.
You can download BUSCO at https://busco.ezlab.org/. It is free.
BUSCO has replaced the discontinued CEGMA (Core Eukaryotic Genes Mapping Approach).
See also Sequence Assembly Practical.
You may also be interested in the following
Career Outlook: Data and Bioinformatics Scientists to 2026
Degree vs. Skills: Impact on salary
Bioinformatics and data science vacancies
Spicy Food may protect you from cerebral infarction and make you live longer
You may also like:
References
1. Daniel H. Huson, Knut Reinert, Saul A. Kravitz, Karin A. Remington, Art L. Delcher, Ian M. Dew, Mike Flanigan, Aaron L. Halpern, Zhongwu Lai, Clark M. Mobarry, Granger G. Sutton, Eugene W. Myers, Design of a compartmentalized shotgun assembler for the human genome, Bioinformatics, Volume 17, Issue suppl_1, June 2001, Pages S132–S139, doi: 10.1093/bioinformatics/17.suppl_1.S132.
2. Wang L, Jiang T. On the complexity of multiple sequence alignment. J Comput Biol. 1994;1(4):337–348. doi: 10.1089/cmb.1994.1.337.
3. Matti Nykänen, Esko Ukkonen, The Exact Path Length Problem, Journal of Algorithms Volume 42, Issue 1, January 2002, Pages 41-53. doi: 10.1006/jagm.2001.1201.
4. Seppey M., Manni M., Zdobnov E.M. (2019) BUSCO: Assessing Genome Assembly and Annotation Completeness. In: Kollmar M. (eds) Gene Prediction. Methods in Molecular Biology, vol 1962. Humana, New York, NY.
5. Chikhi R, Medvedev P, Informed and automated k-mer size selection for genome assembly. Bioinformatics 30:31–37. doi: 10.1093/bioinformatics/btt310.
6. Gregory W Vurture, Fritz J Sedlazeck, Maria Nattestad, Charles J Underwood, Han Fang, James Gurtowski, Michael C Schatz, GenomeScope: fast reference-free genome profiling from short reads, Bioinformatics, Volume 33, Issue 14, 15 July 2017, Pages 2202–2204, doi: 10.1093/bioinformatics/btx153.
7. Kristian A. Stevens, Keith Woeste, Sandeep Chakraborty, Marc W. Crepeau, Charles A. Leslie, Pedro J. Martínez-García, Daniela Puiu, Jeanne Romero-Severson, Mark Coggeshall, Abhaya M. Dandekar, Daniel Kluepfel, David B. Neale, Steven L. Salzberg, Charles H. Langley, Genomic Variation Among and Within Six Juglans Species, G3: GENES, GENOMES, GENETICS July 1, 2018 vol. 8 no. 7 2153-2165. doi: 10.1534/g3.118.200030.
8. Martin Hunt, Taisei Kikuchi, Mandy Sanders, Chris Newbold, Matthew Berriman , Thomas D Otto, REAPR: a universal tool for genome assembly evaluation. Genome Biol 14, R47 (2013). doi: 10.1186/gb-2013-14-5-r47.
9. Simão FA, Waterhouse RM, Ioannidis P et al, BUSCO: assessing genome assembly and annotation completeness with single-copy orthologs. Bioinformatics 2015, 31:3210–3212. doi: 10.1093/bioinformatics/btv351.
10. Waterhouse RM, Seppey M, Simão FA et al, BUSCO applications from quality assessments to gene prediction and phylogenomics. Mol Biol Evol 2018, 35:543–548. doi: 10.1093/molbev/msx319.
11. Parra G, Bradnam K, Korf I, CEGMA: a pipeline to accurately annotate core genes in eukaryotic genomes. Bioinformatics 2007, 23:1061–1067. doi: 10.1093/bioinformatics/btm071
12. Waterhouse RM, Zdobnov EM, Kriventseva EV, Correlating traits of gene retention, sequence divergence, duplicability and essentiality in vertebrates, arthropods, and fungi. Genome Biol Evol 2011, 3:75–86. doi: 10.1093/gbe/evq083.
13. Kriventseva EV, Kuznetsov D, Tegenfeldt F et al, OrthoDB v10: sampling the diversity of animal, plant, fungal, protist, bacterial and viral genomes for evolutionary and functional annotations of orthologs. Nucleic Acids Res 2019, 47:D807–D811. doi: 10.1093/nar/gky1053.
