Pair-wise sequence alignment
Learning objectives:
- To have a basic understanding of how sequences evolve.
- To Know basic terminology for sequence alignments.
- To have a basic understanding of the differences in the construction of DNA and protein sequence alignments..
Introduction
Pair-wise sequence alignment.Pair-wise sequence alignment is one of the fundamental means in bioinformatics to assess a degree of similarity as well as to find differences between two sequences.
Nucleic acid mutations in DNA cause many genetic diseases. Scientists have found these using sequence alignments that allowed comparison between healthy and sick patients' DNA. The famous classic example is sickle cell anemia, which is caused by a single nucleotide change from T to A (Figure 1). Another example is phenylketonuria, PKU, which causes decreased metabolism of phenylalanine and may result in seizures and mental dysfunctions. A single nucleotide mutation from G to A is the cause.

[Click on the image to toggle zoom ◱ ]
Similarity. The similarity measure can tell us whether or not two sequences have the same function. Finding similar sequences in databases is one of the first steps, and probably the most informative step, in identifying newly determined sequences.
Dissimilarity. Dissimilarity in turn, can unveil us point mutations and; thus, reveal causes of genetic diseases. Genomic differences between individuals give us insight into individuals' tolerance or intolerance of a specific medication, and also aid in the proper dosage of medicines. Variation among individual genomic sequences is the fundament of precision medicine or personalized medicine. The old-fashion way to, for example, evaluate dosage, regrettably still today often in practice, is by a person's weight although more up-to-date diagnostics are available. However, healthcare is rapidly changing for the better, given government and private initiatives around the world that have and are sequencing millions of individual genomes for this purpose.
Pair-wise alignments are also an essential element in genome assembly pipelines and alignment of entire genome sequences can identify genes duplications and deletions.
Why are sequences similar?
Chance. Sequences can be similar by random chance alone, but usually, then the similarity tends to be low. A high degree of similarity implies the sequences to originate from a common ancestor. What the similarity threshold is and how to measure it, is a topic of its own. 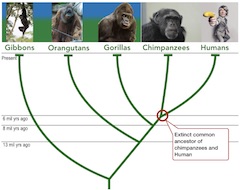
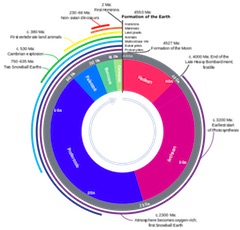
Common ancestry. All living organisms share DNA, which originates from a universal common ancestor. For example, fission yeast (Schizosaccharomyces pombe) and humans had a common ancestor some one billion years ago - yes it is billion with a B. To give some idea about the timescale, Earth formed about 4.5 billion years ago, animals appeared roughly only 600 million years ago, and dinosaurs went extinct mere 66 million years ago.
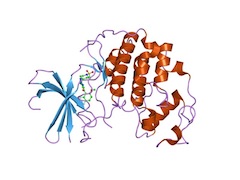
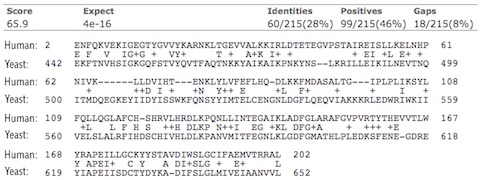
Paul Nurse, a Nobel Laureate, did the first experiment of replacing a gene in yeast by a human one in 1987. The gene he was working with is cdk2, a clock gene which controls the cell cycle and to everybody's amazement, the human gene worked perfectly in yeast. It was a bit like taking a transistor from 1970's Texas Instruments calculator and swap it with one of the semiconductors in today's iPhone, and it still works. It is because both of them are transistors, in other words, they both have the same function. Since then scientists have identified hundreds of genes in yeast that are replaceable with human ones. See the alignment of human CDK2 with yeast.
A comparison of human and chimpanzee genomes reveal them to differ in average 1.2%. We, humans, are on average 99.9% identical, a minuscule 0.1% difference between individuals. On the other hand, given the length of the human genome, over three billion base pairs, 0.1% amounts to about the difference of three million base pairs. Note, that these are measures over the entire length of the genomes.
Genes that share a common ancestor are homologs or homologous genes.
Video 1. Why are genome sequences similar? [2:12]
Convergent evolution. In convergent evolution organisms develop similarities instead of differences; therefore, convergent evolution represents the contrast of divergent as explained above. In other words, in convergent evolution, organisms develop or evolve to acquire similar characteristics, despite not being closely related and their ancestors didn't have any of those features (Figure 4).

If genes don't share a common ancestral gene but yet are alike, we label them only similar, never homologous.
Pair-wise sequence alignment of DNA and RNA
Whether we align DNA or RNA sequences, the approach is the same. The difference is that in RNA U replaces T and the scoring is different, which we explain below in the Pair-wise sequence alignment of protein sequences subsection.

How to assess distinct sequence alignments? Take a look at the two separate alignments of the same two DNA sequences in Figure 5, top and bottom. Are you able to determine whether one of the sequence alignments is better than the other? In case you can, which one is better and why? If the sequences were identical or almost identical and short, there is a possibility to evaluate the alignments by eyeballing them. However, it is not feasible nor even possible to access alignments of long and divergent sequences because there are so many possible different ways to align them and we need to try each of them to be able to choose the best one.
Scoring of sequence alignments. Consequently, we need to obtain a standard and a system to score against this standard. There are different ways to assign scores for matches, mismatches, and gaps; thus, many scoring systems exist, but for the demonstration purposes, we start with a simple one and score each match with +1 and both mismatches (substitutions) and gaps (indels) with -1. The total alignment score is the sum of matches, mismatches, and gaps. Proper alignment, in general, is the one having the least number of substitutions and indels. It is the principle of simplicity before complexity. Alignment algorithms aim to maximize the alignment score and this way, the number of gaps and indels also get minimized, given that matches have a positive score, substitution and indels a negative score.
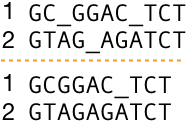
Let's take two sequences (1) and (2) from Figure 5 and make them equal length by adding gaps that mean we align them globally and in two distinct ways as shown in Figure 6 and score them using our simple scoring system. Before you read further, click on Figure 6 to see the alignment scores.
In the top alignment sequence (1) has two gaps, sequence (2) has one gap and the alignment contains in total two substitutions. With our scoring system, we get matches: 6 x (+ 1) = +6, indels: 3 x (-1) = -3 and substitutions: 2 x (-1) = -2, yielding the alignment score of +6 + (- 5) = +1 for the top alignment.
In the bottom alignment sequence (1) has a single gap, sequence (2) no gaps and the alignment contains in total three substitutions. The alignment score is matches: 6 x (+1) = +6, indels: 1 x (-1) = -1 and substitutions: 3 x (-1) = - 3 = +6 + (-1) + (-3) = +2.
The difference between the two alignments is that the top one contains three indels and two substitutions giving a negative score of -5 and the bottom alignment contains only a single indel, but it has one additional substitution; thus, yielding a total negative score of -4. The number of matches is equal in both alignments. Therefore, according to our simple scoring system, the bottom alignment is better than the top one due to the higher alignment score.
So, what does this score mean? In our case here the only thing we can use the alignment score for, is to determine which one of the alignments is better - nothing else.
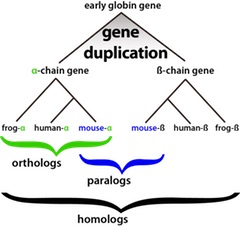
[Click on the image to toggle zoom ◱ ]
Homologous sequences. Based on the percentage of matching bases, 60%, can we assume that these two sequences are homologous, i.e., have a common ancestor? For protein sequences, this question has a general answer: If at least 30% of the amino acids match, 90% of the alignments are anticipated to be homologous. Below 25% identity, less than 10% of the pairs are expected to be homologs. The gap of five percentage units between 25% and 30% is twilight zone, where we are not able to draw any inference, i.e., whether the sequences are homologous or not.
As always the reality is slightly more complicated because these measures are dependent on the lengths of the sequences and the size of the sequence database if we are doing sequence searches. Furthermore, in DNA sequences alignments we only have identities, but protein sequence alignments contain amino acid pairings that are similar. Among the twenty amino acids, there are groups of amino acids that are similar in various characteristics. For example, some amino acids are polar, non-polar, hydrophobic and some hydrophilic and so on; therefore, scoring protein alignments differs from scoring DNA alignments because we can assign different scores for identical and similar amino acid pairings. More on this shortly in the next subsection.
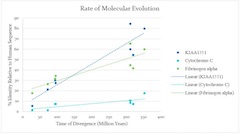
[Click on the image to toggle zoom ◱ ]
Back to the question can we infer homology from DNA sequence alignments? One of the main reasons to infer homology is to determine an unknown gene's function. In general, homologous genes tend to have the same or similar function even when present in different species. When we are dealing with unknown DNA sequences, we don't know from which part of the genome they originate. Genomes contain various other functional elements besides segments that code for protein and also segments that have at least no known function. These segments evolve at different rates; thus, it is difficult to obtain a reliable measure of homology (Figure 8). On the other hand, the good news is that we don't need to. If we can infer homology for genes belonging to separate species' genomes, then the rest of these genomes are also homologous. However, we need to take this with a pinch of salt because it does not mean that all the functional elements in these genomes have the same function.
Finally, note that we didn't use any particular algorithm to construct the above alignments. To learn about the sequence alignment methods and algorithms, take a glance at the subsection related tutorials and choose a relevant tutorial or follow what's next, but don't skip the rest of this tutorial.
Pair-wise sequence alignment of protein sequences
The construction of DNA and protein sequence alignments is the same, the difference lies in how we score substitutions (mismatches).
Protein sequences are more informative than DNA sequences. It takes three bases to code one amino acid, and protein sequences consist of twenty residues instead of just four in DNA. It is meaningless to score base mismatches differently in DNA, i.e., it makes no sense to score pairing of, e.g., T with G differently from a mismatch T-C or T-A. Therefore, the DNA alignment algorithms use a single mismatch score for all mismatches.
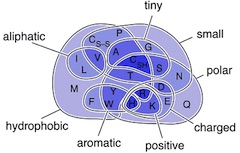
In contrast, we can divide amino acids into distinct groups by their structural, physical, and chemical characteristics and therefore it is advantageous to score each substitution (mismatch) according to the similarity of the amino acid pairing; thus, each substitution has a unique score. This way, protein sequence alignments become more informative than DNA sequence alignments where we only use a single score for all types of substitutions (See further reading: Amino Acid Properties and Consequences of Substitutions for a comprehensive classification).
Click on the figure to toggle zoom.
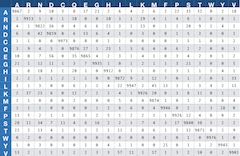
However, to assign substitution scores based on amino acid classification is cumbersome and possibly impossible to tune to yield desired results. A better way is to look at how Nature itself does it. Margaret Dayhoff did this in the 1970s. She and colleagues compared closely related homologous sequences and counted the frequency of each type of substitution. From these data, they derived PAM (Point Accepted Mutations) matrices that can be used to score substitutions. The numbering is from PAM1 to PAM250, the number denoting percentage differences between the sequences. The idea is to apply an appropriate matrix for each particular alignment depending on how similar or different they are.
Click on the figure to toggle zoom.
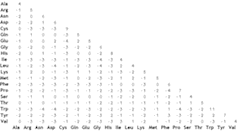
In 1970s Steven and Jorja Henikoff calculated mutation frequencies using multiple aligned protein sequence blocks containing no gaps. Their work resulted in another set of substitution matrices, BLOSUM matrices. Similarly to PAM matrices these BLOSUM matrices also have a number and the most commonly used one is BLOSUM62. However, in contrast to PAM matrices, in which the number refers to percentage differences, in BLOSUM matrices the number refers to similarity. That is, e.g., BLOSUM62 originate from multiple alignments of sequence blocks with at least 62% identity. BLOSUM62 has proven itself to be an excellent general substitution scoring matrix.
Note that these substitution matrices don't contain information for gap penalties, and thus we need to assign them separately.
A detailed description of the construction of these matrices is beyond the scope of this tutorial. It is the topic in the tutorial Construction of substitution matrices.
Finally, you should always use protein instead DNA sequence alignments whenever protein sequences are available, or you when you know the corresponding DNA sequence, which is possible to translate into a protein sequence using a codon table and after that align the translated sequences.
Key Points
Any sequence can be similar to each other, but only sequences that share a common ancestor are homologous sequences or homologs.
Sequences may be similar due to random chance, common ancestry, and convergent evolution.
In DNA sequence alignments all types of mismatches are scored the same. In protein alignments, mismatch scores come from substitution matrices, commonly PAM or BLOSUM.
Substitution matrices don't contain information for gap penalties.
Extra material

What next?
Pair-wise sequence alignment methodsRelated tutorials
Introduction to sequence comparison
Pair-wise sequence alignment methods
Sequence similarity and homology
Construction of substitution matrices
References and further reading
Melanie G. Lee & Paul Nurse, Complementation used to clone a human homologue of the fission yeast cell cycle control gene cdc2. Nature volume 327, pages 31–35 (07 May 1987).
Mitch Leslie, Yeast can live with human genes. May. 21, 2015. sciencemag.org
Kachroo AH, Laurent JM, Yellman CM, Meyer AG, Wilke CO, Marcotte EM, Systematic humanization of yeast genes reveals conserved functions and genetic modularity. Science, 348(6237):921-925 (2015) PubMed. Free access to the PDF.
Burkhard Rost, Twilight zone of protein sequence alignments. Protein Engineering, Design and Selection, Volume 12, Issue 2, 1 February 1999, Pages 85–94, https://doi.org/10.1093/protein/12.2.85
Matthew J. Betts and Robert B. Russell, Amino Acid Properties and Consequences of Substitutions, Chapter 14, Bioinformatics for Geneticists. Edited by Michael R. Barnes and Ian C. Gray, 2003 John Wiley & Sons.
Dayhoff MO, Schwartz RM, Orcutt BC. A model of evolutionary change in proteins. In: Atlas of Protein Sequence and Structure (1978). National Biomedical Research Foundation, Washington, DC.
Dayhoff MO, Schwartz RM, Orcutt BC. Matrices for detecting distant relationships In: Atlas of Protein sequence and Structure (1978), National Biomedical Research Foundation, Washington, DC.
Henikoff S, Henikoff JG. Amino acid substitution matrices from protein blocks. Proc Natl Acad Sci U S A. 1992 Nov 15; 89(22): 10915–10919. PMC.
