Construction of substitution matrices
Objectives:
- To understand how PAM and BLOSUM substitution matrices are constructed.
- To understand how a scoring system reflects similarity in DNA sequence alignments.
- To have a basic knowledge of how to select a substitution matrix to make a relevant database search.
Introduction
It is possible to measure sequence similarity in many different ways, such as counting the number of differences between them (Hamming distance), counting the number of insertions, deletions, and substitutions required to make two sequences identical (Levenshtein distance), percent identity or just use an arbitrary scoring system for matches, mismatches, insertions, and deletions. All these methods yield a measure of a relationship between the sequences, but none reflect any biological association between them.
In the realm of bioinformatics, we are interested in an evolutionary relationship of DNA and protein sequences, except in the case of sequence assembly where measuring sequencing errors and separating repeats are central.
Sequences may be more or less similar by sheer random chance, and consequently, we need a method to distinguish a random similarity from the similarity caused by evolutionary relationship. In other words, we wish to know whether sequences are homologous, i.e., have a common ancestor and in particular whether sequences have the same function despite not having identical sequences. Being able to determine if two sequences have the same function is useful in appraising the function of an unknown protein and gene by comparison to a known one.

[Click on the image to toggle zoom ◱ ]
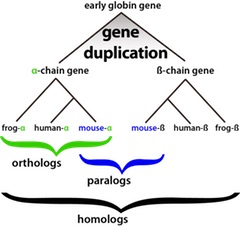
The amino acid sequence of a protein is crucial in determining its structure, and in turn, the function is profoundly dependent on the three-dimensional structure of a protein. Many amino acid mutations resulting in changed amino acids having similar physicochemical properties may not alter a protein structure in any functionally critical way. In contrast, a single amino change may alter the function. Note that we can only observe the cases where an altered function is not deleterious and thus does not result in the death of an organism. Further, changes that result in an altered function still produces homologous proteins, but they are not orthologous anymore since they don't have the same function (Figure 1).
Consequently, by observing mutations among orthologous protein sequences, we can determine which amino acid changes are possible without altering the function of a protein. Further, by enumerating the frequencies of these changes, we can construct scoring systems.
Research first done by Margaret Dayhoff in 1970s and colleagues and later by Henikoff and Henikoff early 1990s resulted in PAM and BLOSUM Substitution matrices and are the most widely used today. This tutorial describes their construction and use.
BLOSUM matrices
By studying a broad set of sequences from different species, known to be homologous and having the same function, i.e., orthologous sequences, we can observe changes in amino acids that preserve a function.

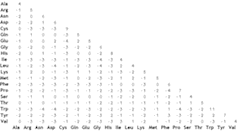
Figure 2. BLOSUM62 substitution matrix. Only half of the matrix is shown, because the two halves are identical. [Click on the image to toggle zoom ◱ ]
To measure the amino acid frequencies, Henikoff and Henikoff analyzed conserved regions of related protein sequences they obtained from BLOCKS database. In total, they examined 2,000 blocks without gaps and 500 groups of related proteins by counting the number of matches and mismatches of each type of the 20 different amino acids.
From the counts of each type, Henikoff and Henikoff created a frequency table and using these frequencies they further computed the probability of each type of match and mismatch and then converted the probabilities into logarithm of odds ratios. This way, the alignment score becomes zero if the observed frequencies are as expected, negative score if frequencies are less than expected and positive score when the frequencies are over the expected frequencies.
However, these are not the final scores in the final BLOSUM matrix. To get the final scores in the matrix, Henikoff and Henikoff further converted the log-odds ratios into bit units and multiplied each bit score by a scaling factor of two and rounded to the nearest integer, producing the final scores in BLOSUM matrix.
A family of matrices
Sequences in a whole protein family cluster may be quite divergent due to contributions of distant relatives. Therefore, Henikoff and Henikoff divided the family clusters into sub-clusters by their percentage of similarity to reduce multiple contributions to amino acid pair frequencies. This division resulted in BLOSUM family of matrices where the associated number, e.g., BLOSUM65 means scores are from a cluster of sequences where sequences are at least 65% similar, in BLOSUM80 matrix scores are from clusters with at least 80% similarity and so on.

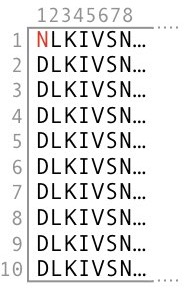
Figure 3. Example column of sequence alignment of ten sequences of a conserved block. Nine Ds and one N.
The math
As an example, we consider a column consisting of nine Ds and one N. There are nine N-D and nine D-N pairs, and 36 (1 + 2 + 3 + ... 8) possible D-D pairs (Figure 3).
To create a frequency table, we count the number of times, \( n \), each of the 210 (20, 19 + ... 1) possible amino acid pairs occur in a block of a depth of \( d \) sequences as follows: \( wd(d-1)/2=n \), where \( w \) is the number of columns in the block. In this example \( d = 10 \) and \( w=1 \); Thus, the block contributes 1x10x(10-1)/2 = 45 amino acid pairs to the count.
The observed probability of occurrence \( q_{ij} \) of each amino acid pair \( i \), \( j \) is
\[ q_{ij} = \frac{ f_{ij} }{ \sum_{i=1}^{20} \sum_{j=1}^{j} f_{ij} } \]
Where \( 1 \leq i \leq j \leq 20 \). Inserting the numbers in the above equation in our example in Figure 2, we get the following: \( f_{DD}=36 \), \( f_{DN}=9 \), \( q_{DD}=36/45=0.8 \), and \( q_{DN}=9/45=0.2 \).
Subsequently, we estimate the probability of occurrence \( P(x) \) of each amino acid as
\[ P(x)=\frac{observed\: frequency\: of\: occurrence}{total\: number\: of\: possible\: occurrences} \]In our example 36 sequence pairs have D in both positions, and nine pairs have D only in a single position; thus, the expected probability \(P(D) = \frac{[36+(9/2)]}{45} = 0.9\) and \(P(N)=\frac{(9/2)}{45}=0.1\), assuming that the observed frequencies are the same as in the population. The general formula for calculating the probability of the occurrence \( p_{ij} \) of the \(i\)th amino acid in an \(i\), \(j\) pair is
\[ p_{ij} = q_{ij} + \sum_{j \ne i}^{} \frac{ q{ij} } {2} \]
The calculation of the expected probability of occurrence of each amino acid pair is \(p_{i}p_{j}\) for \(i=j\) and \(p_{i}p_{j}+p_{j}p_{i}=2p_{i}p_{j}\) for \(i \ne j\). In our example this gives DD\( =0.9 \times 0.9=0.81\) and for DN+ND\(=2 \times (0.9 \times 0.1)=0.18\).
To get a handy scoring \(s_{ij}\), we first compute an odds ratio table where an entry \(e_{ij}\) for each amino acid pair is \(\frac{q_{ij}}{e_{ij}}\) and then take a logarithm of base two of each entry \(s_{ij}=\log_{2}(\frac{q_{ij}}{e_{ih}}) \). This scoring results in the alignment score \(s_{ij}\) to become zero if the observed frequencies are as expected, to a negative score if frequencies are less than expected and to a positive score when the frequencies are more than expected frequencies.
We then multiply each score \(s_{ij}\) by two and round to the nearest integer to generate the final scores in BLOSUM matrices (Figure 2).
Why don't different identical amino acid pairings have the same score?
By looking at the BLOSUM62 scores, we can observe that the identity pairing of different amino acids does not get the same score. The reason is that the observed abundance of amino acids is not the same. For example, Leucine-Leucine (Leu-Leu) pairing gets score four and Tryptophan-Tryptophan (Trp-Trp) pairing gets score 11 because Leucine is observed to be more abundant in nature than Tryptophan; Thus, Trp-Trp pairing is less likely to be a random one.
Hypothesis testing
The above method of scoring is, in fact, hypothesis testing, and in general, the score \(S(a,b)\) for a substitution of amino acid \(a\) with amino acid \(b\) is
\[ S(a,b) = \frac{1}{\lambda} \log_{2} \bigg( \frac{P_{ab}}{f_{a}f_{b}}\bigg) \]where \(P_{ab}\) is the observed probability of substitution in an alignment, \( f_{a}f_{b} \) is the probability of a random substitution based on the abundance of amino acids and \( \lambda \) is a scaling factor. To arrive at total alignment score, we need to multiply the probability of each amino acid pairing with another along the full alignment, but by taking a logarithm of the probability, we can do addition instead of multiplication.
In the above equation \(P_{ab}\) is the likelihood of the hypothesis we want to test: residues correlated because they are homologous and \( f_{a}f_{b} \) is the likelihood of a null hypothesis: residues are unrelated.
